Activity
What the Activity screen shows
The Activity screen plots your device's power draw and water temperature over time, so you can see when and how hard it worked. Totals for the period you pick sit below the chart. This is activity, not energy cost: for a day-by-day cost view, see Energy cost.
Find it on the Activity tab in the bottom navigation, or in the sidebar on larger screens.
Choosing a time range

The time range selector sets how much the chart and the summary cover. Pick from eight ranges: 1 hour, 6 hours, 24 hours, 7 days, 30 days, 90 days, 1 year and 5 years. The app remembers your last choice and opens with it next time.
Plan limits apply to the longer ranges:
- The free plan includes ranges up to 7 days.
- The 30-day, 90-day, 1-year and 5-year ranges need Premium.
- Tapping a locked range offers the upgrade without changing your current view.
Reading the chart
The chart plots two measurements over your chosen period:
- Power draw. How hard the device is working at each moment, drawn as a shaded area.
- Water temperature. Drawn as a line on its own axis. The line appears only when temperature readings exist for the period.
Longer ranges average the readings so the shape stays clear. A period with no readings keeps its time axis and shows a note that no data is available.
The totals below the chart
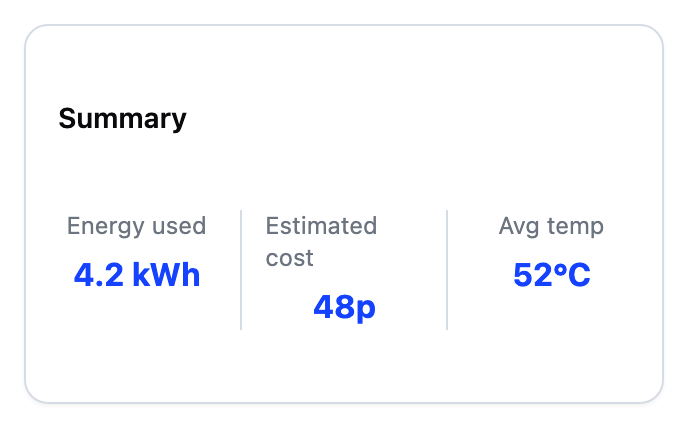
A summary sits below the chart and totals the selected period. It shows the energy used in kWh, the estimated cost from your tariff, and the average temperature. A dash means a figure is not available, usually because there are no readings, or no tariff for the cost.
Frequently asked questions
What if the screen fails to load?
A failed load shows a Retry button. Tap it to fetch the data again. If you see a message that the range needs Premium, your plan's window is shorter than the range you picked. Choose a shorter range, or upgrade from the plan screen.
Why are some time ranges locked?
The free plan covers up to 7 days. The 30-day, 90-day, 1-year and 5-year ranges are part of Premium. Tap a locked range to see the upgrade option.
Why does the chart say no data is available?
There are no readings for the period you picked. This happens if the device was offline or only recently set up. The time axis stays visible so you can tell which period you are looking at.
Why is the temperature line missing?
The line only draws when temperature readings exist for the selected period. Power-only periods show just the shaded power area.
Why is the estimated cost a dash?
Cost needs both readings and a tariff. If your tariff is not set up yet, add it from the More menu and cost figures appear across the app.